Nexus Analytics Dashboard
A comprehensive SaaS analytics dashboard featuring real-time data visualization, user management, and automated reporting.
Overview
Nexus Analytics is a powerful SaaS platform designed to give businesses a 360-degree view of their performance. From real-time traffic monitoring to deep user behavior insights, Nexus provides the data needed to make informed decisions. The project focused on high performance, processing large datasets on the client-side without lag, and accessibility, ensuring the dashboard is usable by everyone.
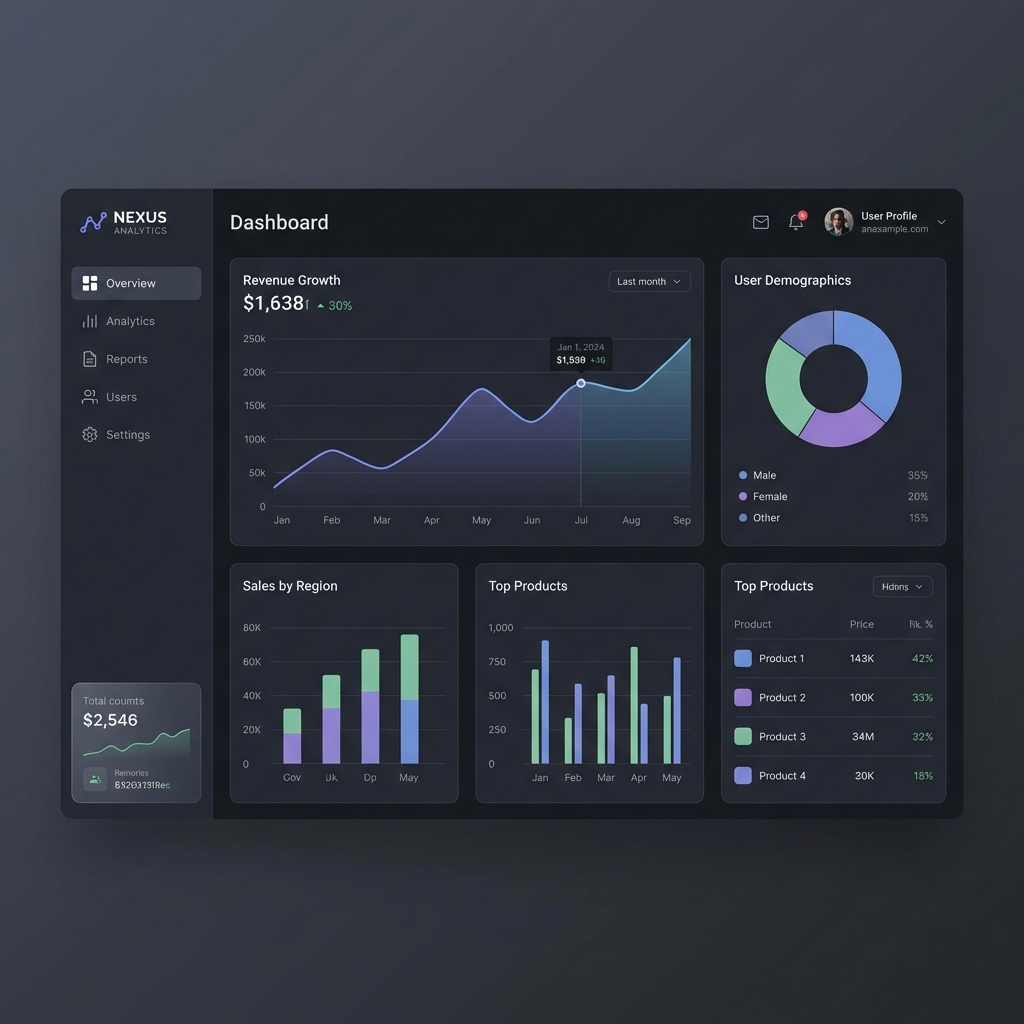
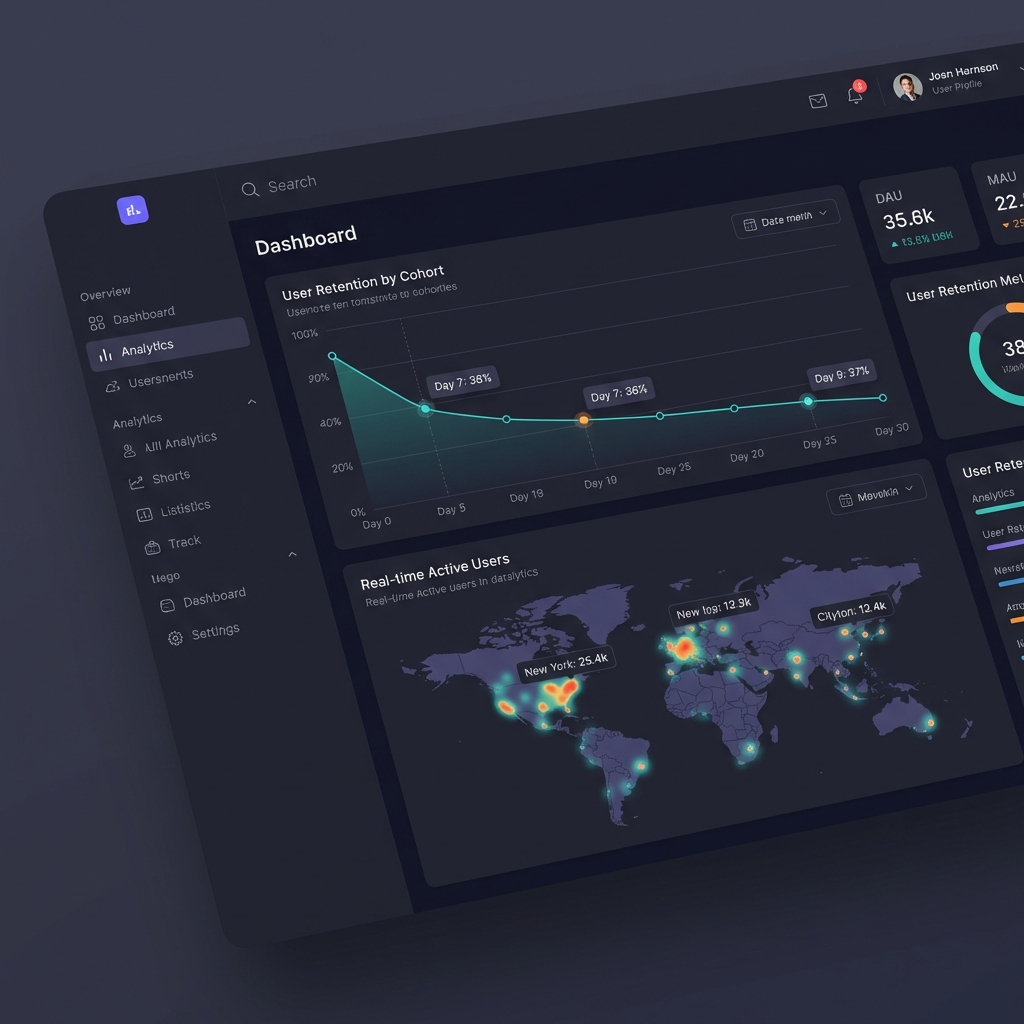
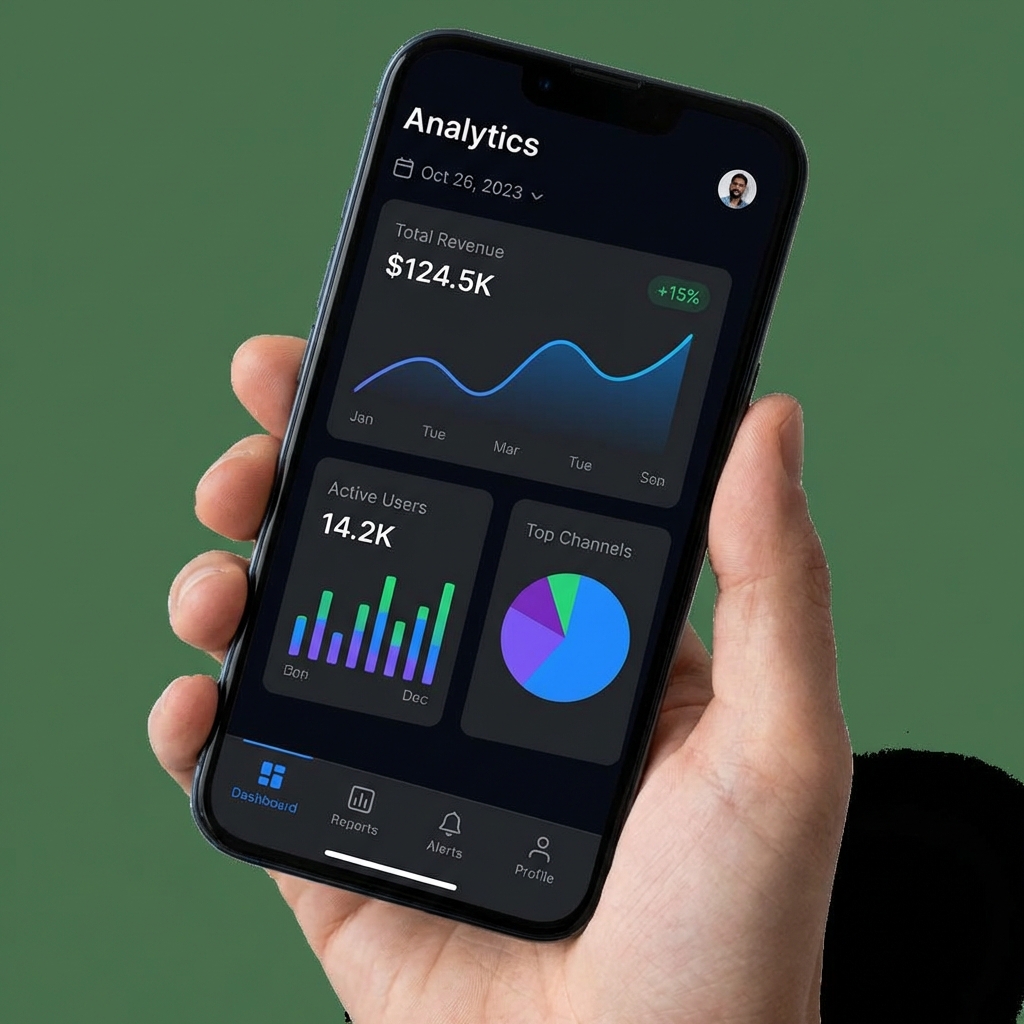
Gallery
Key Features
- Real-time data visualization using WebSockets
- Customizable dashboard layouts
- Role-based access control (RBAC)
- Automated PDF report generation
- Dark/Light mode support
Challenges
One of the main challenges was optimizing the rendering of large datasets in real-time charts. We solved this by implementing data aggregation on the backend and using virtualized lists and canvas-based charts on the frontend to maintain 60fps performance.